

2Q26 Earnings Read-Throughs: What Six Reports Tell Us So Far
MOH, CYH, THC, MEDP, TMO and DGX sharpen the debates around coverage-driven mix pressure and improving biopharma demand.
Bottom line. Six healthcare services companies have reported since the July 22 close—MOH, CYH, THC, MEDP, TMO and DGX. All fall outside Graver Research’s current 10-stock core coverage universe, but their results help sharpen two active debates with direct implications for covered names. The first is whether coverage attrition is reducing care use or primarily just reshaping insurer risk pools and provider payer mix. The second is whether improving biopharma customer activity is beginning to translate into a firmer clinical-research demand environment for CROs.
On the first debate, the evidence points more toward mix pressure than an outright decline in demand. MOH underestimated the concentration of high-cost members in a deliberately smaller Marketplace book. THC, CYH and DGX indicate that many patients losing exchange coverage continue to use healthcare services, often with a less favorable payer profile. The operating pressure is visible across the system, but the earnings impact and stock reaction depends on each company’s starting assumptions, exposure, pricing, service mix and cost execution.
THC provides the most directly comparable read-through to HCA. Its admissions, uninsured-mix and inpatient-surgery trends closely resembled HCA’s preliminary results, yet Tenet delivered a large underlying beat and raised guidance. The release supports HCA’s account of the operating environment, but it does not support treating HCA’s negative EBITDA reset as the default outcome for the hospital group.
The managed-care signals are more company-specific. MOH’s Medicaid results are most relevant to CNC and broadly consistent with ELV’s outlook: cost pressure remains elevated but stable, and improving 2027 rate support reinforces the case that 2026 marks the margin trough, although neither company has shown that recovery is underway. MOH’s Marketplace miss is a real adverse-selection warning for ELV, but not a direct contradiction of ELV’s 2Q ACA upside. The companies entered the year with different, only partly disclosed earnings baselines, and ELV’s upside was not clean evidence of better current-year claims experience. For UNH, MOH’s improved dual-eligible Medicare performance is directionally consistent with UnitedHealthcare’s stronger 2Q Medicare result. Neither company’s performance, however, establishes a broader MA cost-trend inflection.
On the second debate, MEDP and TMO both reported improving biopharma customer activity. The breadth of TMO’s commentary and the recovery in MEDP’s RFP environment make the external demand setup more constructive for IQV, although neither result provides a reliable point estimate for IQV bookings.
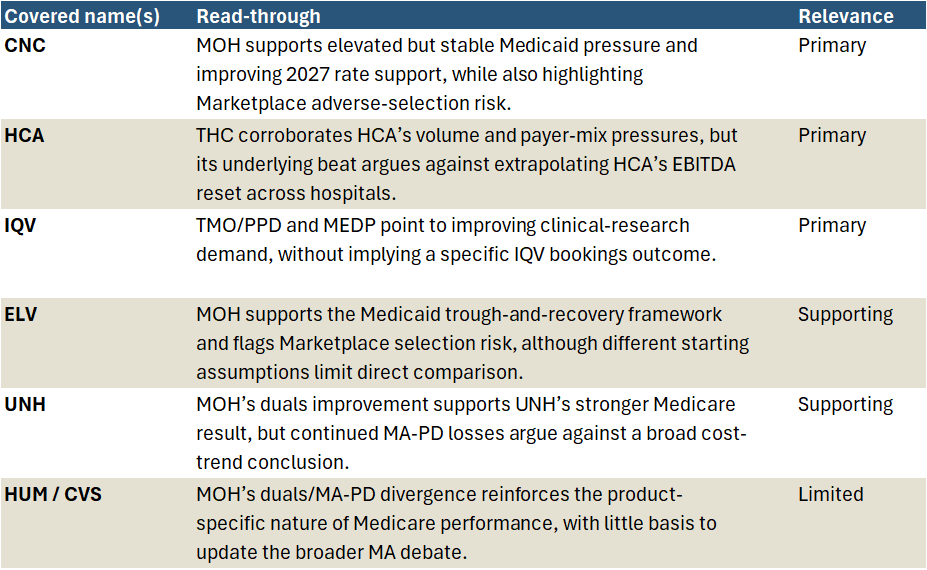
Exhibit 1: The six reports matter most for CNC, HCA and IQV
The reports directly inform three coverage debates; implications for other covered names are narrower or more company-specific
Coverage attrition is changing who pays—and who remains insured
MOH entered 2026 expecting a sharply smaller but profitable Marketplace business. Average pricing increased approximately 30%, while membership declined 59% year over year to roughly 280,000, and the company targeted an 85.5% MCR and a 1.7% pretax margin. First-quarter performance appeared to validate that setup: the normalized MCR was 79.5% and in line with plan.
Second-quarter claims exposed a flaw in the original assumption. MOH had priced for adverse selection, but the remaining book retained more members with high-cost drugs, oncology care and HIV treatment than expected. Risk adjustment did not fully offset those claims. The company increased its Marketplace MCR outlook ~450 bps to approximately 90% and lowered the segment’s contribution by $1.50 per share, from a $0.75 profit to a $0.75 loss.
The headline loss overstates the current-year deterioration. Management attributed approximately $1.00 per share of the revised $0.75 loss to prior-year items and still expects roughly $0.25 of profit from 2026 activity. Even so, the current-year outlook weakened by approximately $1.00 per share, and MOH plans to reduce the business by another $1 billion in 2027. Its 2026 experience is therefore relevant as an adverse-selection case study, not as a representative industry sample. Management noted that MOH has only about 1% of industry-wide Marketplace enrollment.
ELV’s result does not provide a clean counter-signal. ELV also priced for higher morbidity after the expiration of enhanced subsidies, but it did not disclose a comparable starting MCR or margin. Management said after both the first and second quarters that the risk pool was developing broadly in line with its assumptions. The approximately $0.25 of ACA upside reported in 2Q included bronze-plan seasonality and favorable final 2025 risk adjustment; most of the risk-adjustment benefit was re-established in the 2026 accrual.
The comparison is still useful, but for a narrower reason. MOH shows that large rate actions and deliberate membership contraction do not eliminate selection risk. ELV shows that the financial outcome also depends on what was embedded in the starting forecast. Pricing, geography, metal-tier mix, risk adjustment and the initial morbidity assumption remain critical. Available disclosures do not establish whether MOH’s pressure is sector wide.
Provider results show where some displaced utilization is landing. CYH said most patients who lost exchange coverage continued to use its hospitals as self-pay. Self-pay and uncompensated visits increased from just under 5% to more than 6%, and approximately half of adjusted-admission growth came from uninsured encounters that produced little net revenue. CYH now expects a $50–$75 million full-year HIX-related EBITDA headwind.
DGX saw a similar selection effect without the same collections pressure. The company estimated ACA enrollment had fallen more than 20%, while related requisitions declined only 8%. Tests per requisition rose 6%, leaving test volume down roughly 2% and revenue approximately flat. Patient collections and bad debt remained stable. The patients who retained coverage, or continued to seek testing after losing it, used more diagnostic services per encounter.
These observations support HCA’s explanation that exchange disenrollment increased uninsured utilization and reduced the economics of otherwise healthy patient traffic. They do not imply that all providers face the same earnings pressure. Diagnostics, ambulatory care and acute-care hospitals have different exposure to payer mix, acuity and collection risk.
Medicaid pressure looks stable; recovery still has to be earned
MOH increased its 2026 adjusted EPS floor by $0.25 to $5.25, but the segment bridge was volatile. Medicare improved by $1.50 per share, Medicaid improved by $0.25, and Marketplace deteriorated by $1.50.
Medicaid cost trend remained approximately 5% against roughly 4% rate growth. The second-quarter MCR rose to 92.7% from 92.0% in the first quarter, although management described utilization as high and stable rather than worsening. Behavioral health, specialty pharmacy, outpatient professional services and inpatient care remained the main pressure points. MOH still expects only a 1.2% Medicaid pretax margin in 2026, and approximately 55% of its premium does not reprice until January 1, 2027.
The read-through is most relevant to CNC. Stable utilization and improving state rate actions support the view that 2026 can mark the trough in Medicaid margins. They do not establish an inflection in current profitability. The timing of rate resets, mix of state programs and benefit design make exact MCR comparisons unreliable.
MOH’s experience is also consistent with ELV’s unchanged outlook for an approximately negative 1.75% Medicaid margin. Both companies describe cost pressure as elevated but no longer accelerating, with stronger rate support ahead. Neither has yet produced evidence of a sustained margin recovery.
Medicare was better, but product-specific. MOH lowered expected cost trend in its dual-eligible business to approximately 4% from 6%, supporting $1.50 per share of upside. Traditional MA-PD still represents an estimated $1.00 per-share loss and will be exited. The duals improvement is directionally consistent with UNH’s better Medicare performance. It does not establish a broad utilization inflection for HUM or CVS.
THC confirms HCA’s operating pattern—not its earnings outcome
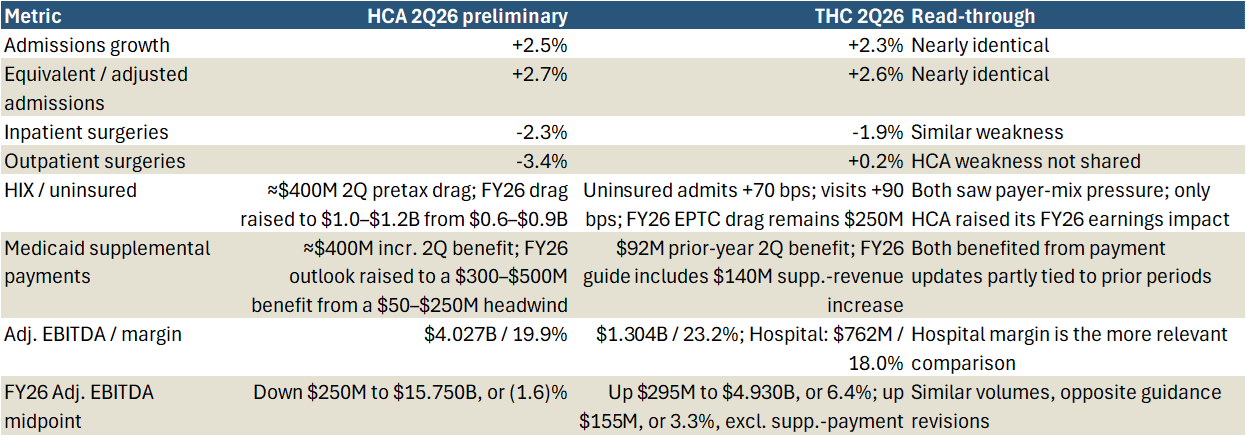
Tenet and HCA reported strikingly similar hospital volume trends. THC’s same-hospital admissions and adjusted admissions increased 2.3% and 2.6%, respectively, compared with HCA’s 2.5% and 2.7%. Inpatient surgeries fell 1.9% at THC and 2.3% at HCA. Tenet also saw clear coverage pressure: charity and uninsured admissions increased 70 basis points, related visits increased 90 basis points, and its uncompensated-care ratio rose 330 basis points to 29.6%.
The earnings results diverged. THC’s $1.304 billion of adjusted EBITDA exceeded consensus by 14.4%. The quarter included a $92 million favorable Medicaid supplemental-revenue adjustment related to prior years. Removing the full amount leaves approximately $1.212 billion of EBITDA, still 6.3% above consensus and 8.1% above last year. On the same conservative adjustment, hospital margin was approximately 16.2%, about 60 basis points higher year over year.
Tenet increased the midpoint of 2026 EBITDA guidance by $295 million. The bridge included $140 million of incremental Medicaid supplemental revenue, $97 million of first-half outperformance and $58 million of expected second-half improvement. Excluding the supplemental-payment update, the operating outlook improved by $155 million. The new $4.93 billion midpoint stands 6.4% above prior guidance and 5.8% above pre-print consensus.
The contrast with HCA begins with the starting assumptions. Tenet continues to incorporate a $250 million full-year headwind from the expiration of enhanced premium tax credits. HCA raised its estimate of the same broad pressure from $600–$900 million to $1.0–$1.2 billion and lowered its EBITDA midpoint by $250 million. THC therefore does not refute HCA’s payer-mix explanation. It shows that exposure, prior assumptions, pricing, Medicaid supplemental payments and expense execution can lead to different earnings outcomes in a similar volume environment.
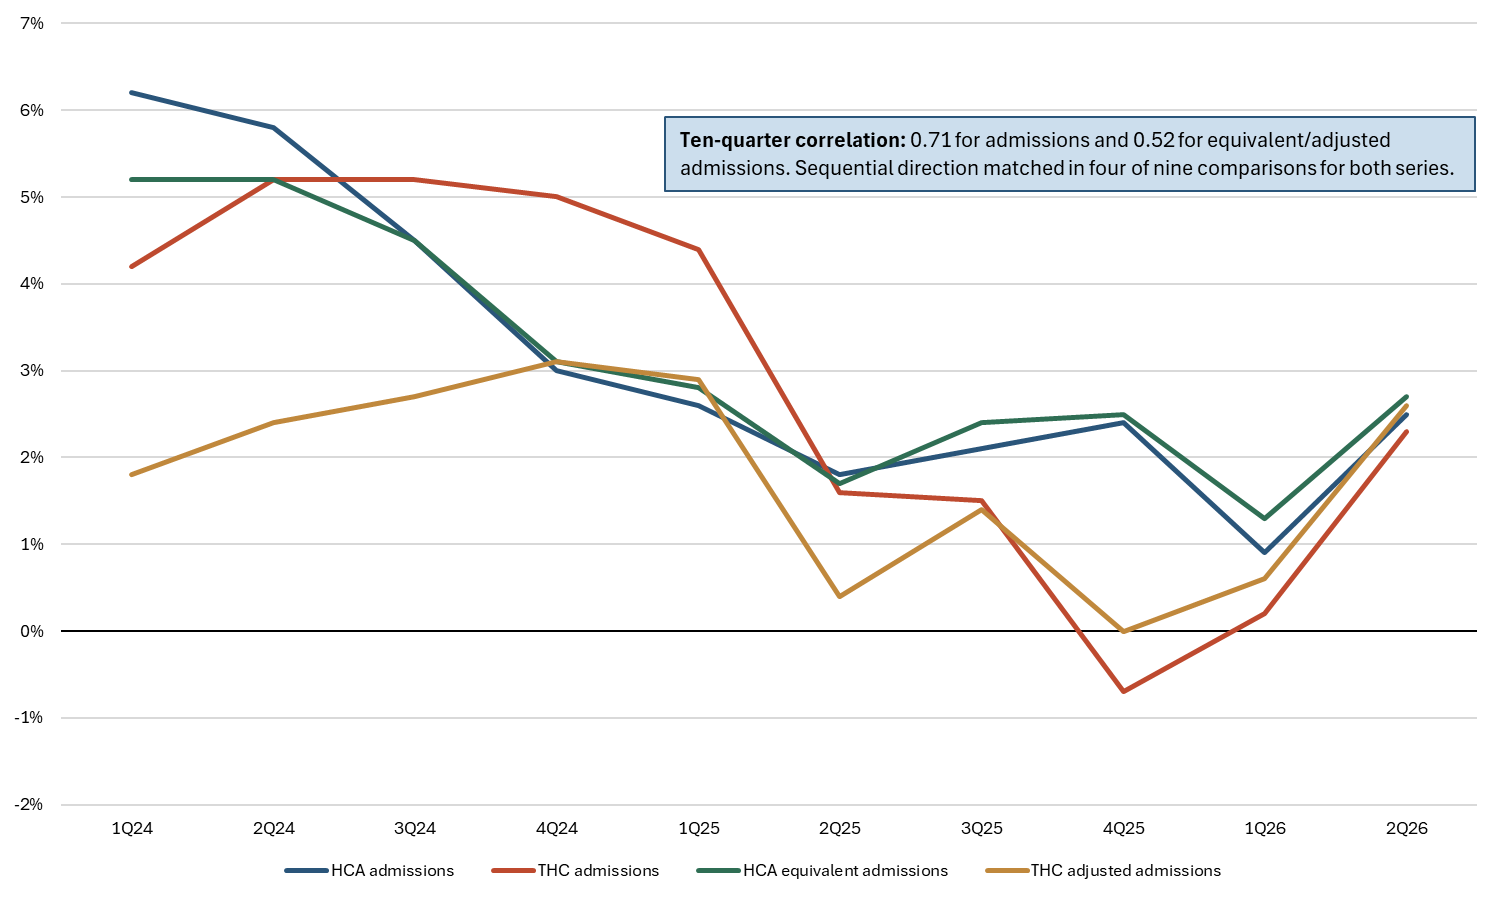
Historical comparability also argues for restraint. From 1Q24 through 2Q26, HCA and THC admissions growth had a correlation of approximately 0.71, but equivalent and adjusted admissions correlated only 0.52; sequential direction matched in four of nine comparisons. CYH was directionally similar over the same period, with correlations of approximately 0.69 for admissions and 0.68 for equivalent or adjusted admissions. Those relationships are useful corroboration, not forecasting tools.
CYH’s surgery data deserve even less weight. Definitions have not been consistent enough for a standardized series, and the companies have diverged in prior quarters. CYH’s current 3.8% decline in inpatient surgeries supports the direction of HCA’s reported mix weakness, but it should not be used to estimate HCA’s future volumes or earnings.
Exhibit 2: THC confirms HCA’s operating pressures, but not its earnings outcome
HCA and THC reported nearly identical admissions and inpatient-surgery trends in 2Q26. Tenet’s underlying beat and guidance increase show that similar operating pressures do not produce a uniform earnings outcome.
Panel A: 2Q26 operating and earnings comparison
Panel B: Historical volume comparison
MEDP and TMO improve the demand setup for IQV
MEDP’s net new awards increased 28% to $796 million, producing a 1.13x book-to-bill ratio. RFP activity improved sequentially and year over year, and management described a broader group of recently funded biotechnology customers. That is constructive after an extended period of uneven funding and cautious trial starts.
The quality of the rebound needs qualification. More than half of the sequential improvement in net bookings came from fewer cancellations rather than higher gross awards. Oncology represented more than half of bookings and award notifications, and several large metabolic programs still influence customer concentration. MEDP is also more exposed than IQV to small and mid-sized biotechnology sponsors.
TMO provides the stronger cross-check because PPD (TMO’s CRO subsidiary) has greater large-pharma and global CRO exposure. Pharma and biotechnology organic growth reached the mid-single digits, led in part by clinical research. Management said clinical-research authorizations had been strong for several quarters and typically require about six months to convert into revenue. Improving biotechnology spending is now appearing in reported growth, and TMO modestly raised its second-half organic-growth assumptions.
The combined evidence raises confidence in a firmer clinical-research demand environment into the second half and 2027. It does not justify a specific IQV book-to-bill estimate or a market-share conclusion. MEDP’s sponsor mix differs, while TMO sells PPD as part of a broader integrated offering. The appropriate read-through is improved end-market direction.
The setup into the print is shaping the stock reaction
At this stage, the tape is better read against what each stock had already priced in and the size and quality of the earnings reset. Consensus revisions remain incomplete and are not yet a useful measure.
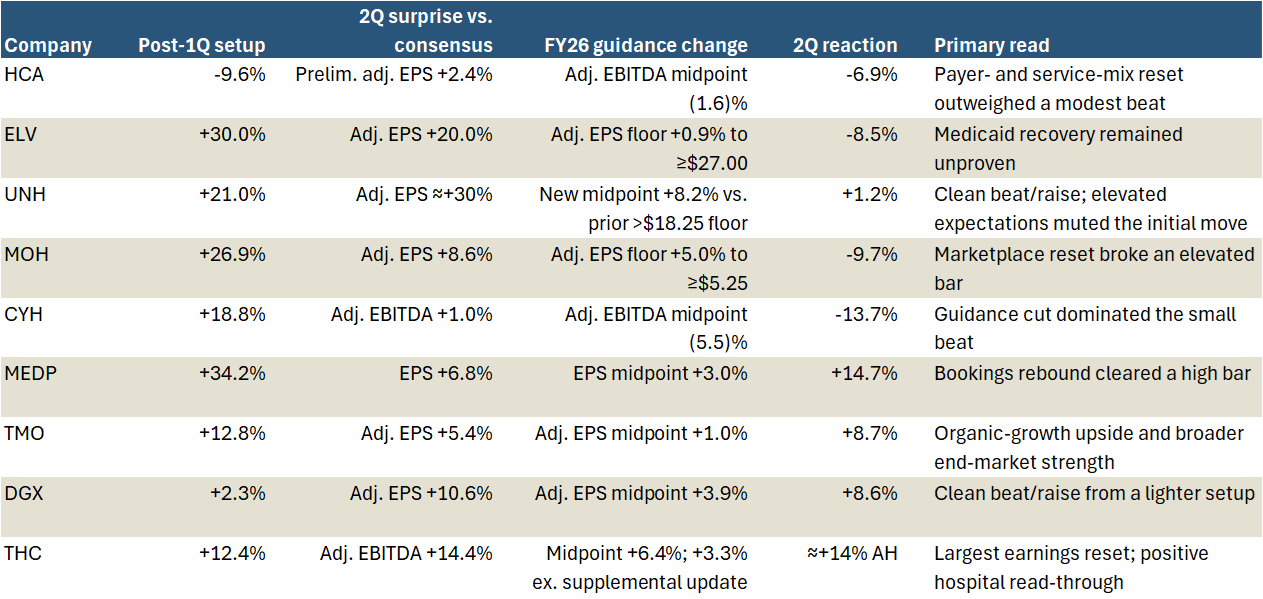
ELV and MOH show why the setup matters. From the first close after their 1Q results were fully absorbed to the pre-2Q close, the stocks rose 30.0% and 26.9%, respectively. Both companies then beat quarterly EPS and raised FY26 guidance, yet ELV fell 8.5% and MOH declined 9.7% in the first full post-print session. The headline math was positive, but neither result cleared the bar embedded in the stock. ELV did not show that Medicaid margins had begun to recover, while MOH’s Marketplace reset weakened confidence in its forward earnings base.
UNH provides a useful counterpoint. Shares had gained 21.0% since the post-1Q close before the company delivered a roughly 30% adjusted EPS beat and raised guidance to $19.50–$20.00. The stock gained only 1.2% in the first session, although the cumulative move reached 4.3% through July 21. The result was clean, but expectations had already risen materially.
HCA and CYH are more straightforward guidance reactions. HCA had declined 9.6% since its 1Q report, but the preliminary update lowered the FY26 EBITDA midpoint 1.6% and drove another 6.9% decline. CYH entered its report up 18.8%, delivered only a 1.0% EBITDA beat, cut its guidance midpoint 5.5%, and fell 13.7%.
The positive reactions were backed by cleaner earnings resets. MEDP, TMO and DGX gained 14.7%, 8.7% and 8.6%, respectively, after beating the relevant quarterly measure and raising guidance. MEDP’s move was particularly notable after a 34.2% run-up, suggesting the bookings rebound mattered more than the guidance increase alone. THC was the clearest case: adjusted EBITDA exceeded consensus by 14.4% and the new midpoint rose 6.4%, supporting an approximately 14% after-hours gain. The concurrent moves in HCA and UHS indicate that investors viewed part of Tenet’s result as transferable to the hospital group.
Exhibit 3: The stock reaction reflects both the earnings reset and the pre-print setup
The post-1Q return provides context for the expectations embedded in each stock. The first post-print move then shows whether the quarter and revised outlook cleared that bar.
Implications for core coverage
The highest-value read-throughs are concentrated in three names. For CNC, MOH supports a stable Medicaid cost trend and better 2027 rate support, while highlighting the selection risk in a shrinking Marketplace book. For HCA, THC validates the payer- and surgery-mix pressure but makes HCA’s earnings reset look less transferable across the hospital group. For IQV, MEDP and TMO provide the strongest external evidence this quarter that clinical-research demand is improving.
The evidence for the remaining names is narrower. MOH’s duals performance is consistent with UNH’s stronger Medicare result, but does not resolve the broader MA debate for HUM or CVS. ELV’s Marketplace result cannot be compared with MOH’s without accounting for different starting assumptions. The six reports do not materially change the outlook for CI, MCK or COR.
The next useful evidence will come from the HCA and THC calls. The release-level data already establish the operating pattern; management commentary should determine whether the divergence in earnings was driven mainly by exposure and starting assumptions or by a more durable difference in pricing, service mix and expense execution.