

ELV 2Q26: The Beat Was Real, but Medicaid Still Has to Prove the Turn
Normalized EPS beat consensus by 7%, but an unchanged –1.75% Medicaid margin outlook and a modest guide raise outweighed MA and ACA upside, sending shares down 12.6% over three sessions.
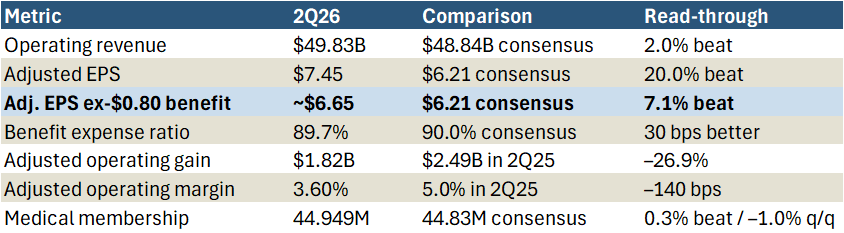
Bottom line. ELV delivered a better second quarter than the share-price reaction suggests, but not the Medicaid evidence needed to sustain a stock that had rallied sharply into the print. Adjusted EPS of $7.45 exceeded the $6.21 consensus, although approximately $0.80 came from a non-recurring net below-the-line benefit. Excluding that item, adjusted EPS of roughly $6.65 still beat expectations by $0.44, or 7.1%. Management also quantified approximately $0.50 of operating outperformance, split about evenly between Medicare Advantage and Individual ACA.
The problem was less the quarter than the path forward. July Medicaid rate updates were better than expected, membership and acuity were broadly in line, and management described the cost pressures as elevated but understood. Yet the full-year Medicaid operating margin outlook remained approximately negative 1.75%, management is not assuming material medical-cost trend improvement in the second half, and ELV expects additional market exits. The market wanted proof that better rates and operating actions were translating into margin recovery; 2Q26 offered a better setup, but not that proof.
Exhibit 1. 2Q26 at a glance
The beat was real — just not fully recurring
The cleanest way to read the quarter is in three layers. First, reported adjusted EPS was $7.45. Second, removing the approximately $0.80 net below-the-line benefit produces roughly $6.65, still 7.1% above consensus. Third, management said operating outperformance was approximately $0.50, split about evenly between Medicare Advantage and Individual ACA. That makes the result meaningfully better than a one-time-assisted headline beat.
The tension is that strong benefit expense performance did not translate into year-over-year earnings growth. The 89.7% benefit expense ratio was 30 basis points better than StreetAccount consensus, but adjusted operating gain still declined 26.9% to $1.82 billion and adjusted operating margin fell 140 basis points to 3.6%. Health Benefits operating margin declined 170 basis points to 2.1%. In other words, the quarter beat a low bar while the underlying earnings base remains well below last year.
The guide rose to $27, but the recurring baseline is $26
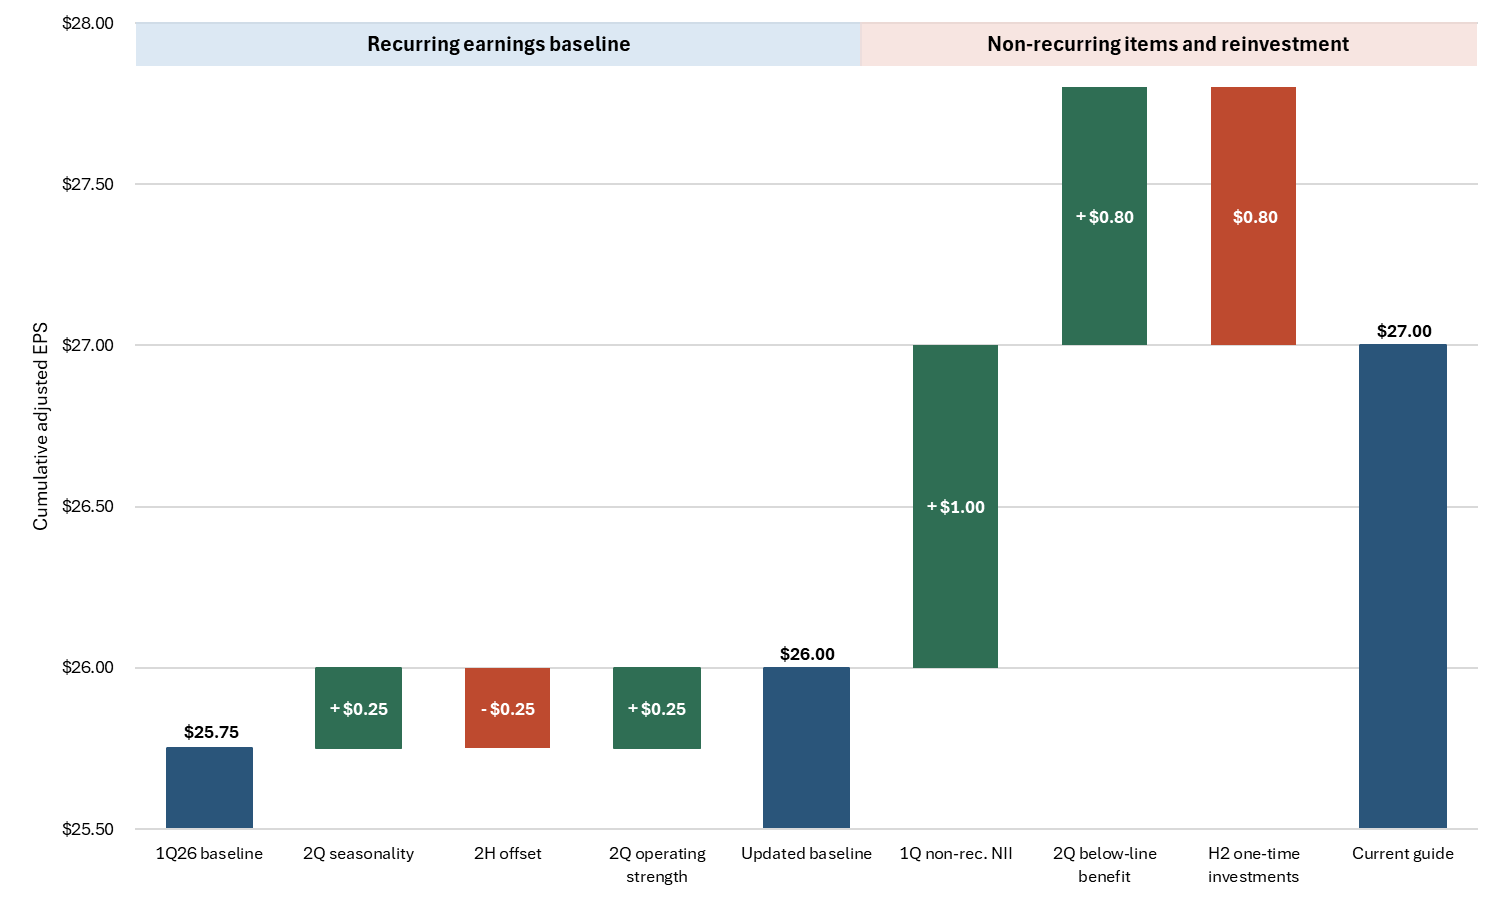
ELV raised 2026 adjusted EPS guidance by $0.25 to at least $27.00, versus the $26.87 pre-print consensus. The full bridge is more informative than the headline. Management’s recurring earnings baseline increased from at least $25.75 to at least $26.00; approximately $0.25 of 2Q seasonality is expected to reverse in the second half, while $0.25 of operating strength is retained. The approximately $0.80 second-quarter below-the-line benefit is being redeployed into accelerated one-time investments and therefore contributes nothing net to the full-year guide.
The remaining $1.00 gap between the $26.00 recurring baseline and the $27.00 reported guide reflects the non-recurring investment-income benefit recognized in the first quarter. The raise is therefore recurring, but the reported guide is not the correct jumping-off point for 2027.
Exhibit 2. ELV’s $27 guide contains a $26 recurring earnings baseline
The bridge separates operating improvement from timing and non-recurring items. It also shows why the 2027 growth target begins at $26.00 rather than the reported $27.00 guide.
At least 12% growth from the $26.00 baseline implies a 2027 EPS floor of $29.12. That is only 7.9% above the reported 2026 guide. Current 2027 Bloomberg consensus is at $29.50, just $0.38 above management’s floor. The 2027 target is achievable on paper, but it leaves little room for slippage in the Medicaid recovery, Carelon growth, operating efficiency, or capital deployment assumed to support it.
Medicaid was not worse — but it was not better enough
The negative 1.75% Medicaid margin outlook is not new. ELV established it with fourth-quarter results in January, maintained it after the strong first-quarter print, and maintained it again in 2Q26. That continuity matters: the second quarter did not reveal a new acuity shock or a new step-up in cost trend. Management said membership and acuity remained broadly aligned with expectations, while the principal cost drivers — behavioral health, including ABA therapy; emergency department utilization; outpatient surgery; and specialty pharmacy — were familiar and actionable.
The disappointment is that the better rate picture did not change the full-year margin. July 1 rate updates moved toward the upper end of a mid-single-digit range, versus the lower end assumed at the start of the year. ELV expects the second-half margin to improve from 2Q26 as those rates and cost actions take hold, but it is not assuming material improvement in medical-cost trend. The company also confirmed its D.C. exit and expects to leave additional Medicaid markets over the next 12 to 18 months where it does not see a path to sustainable returns.
Our interpretation is that management is preserving room for volatility rather than signaling a hidden step-down in the business. Even so, unchanged guidance after better rates creates a burden of proof: either the rate upside is being absorbed by continued utilization pressure, or the company is holding conservatism that needs to convert into later upside.
Exhibit 2. Every 50 bps of Medicaid margin recovery is worth about $1.00 of EPS
At ELV’s current Medicaid revenue base, even partial margin recovery is material to the 2027 earnings algorithm. The sensitivity below illustrates why investors are focused so heavily on this one segment.
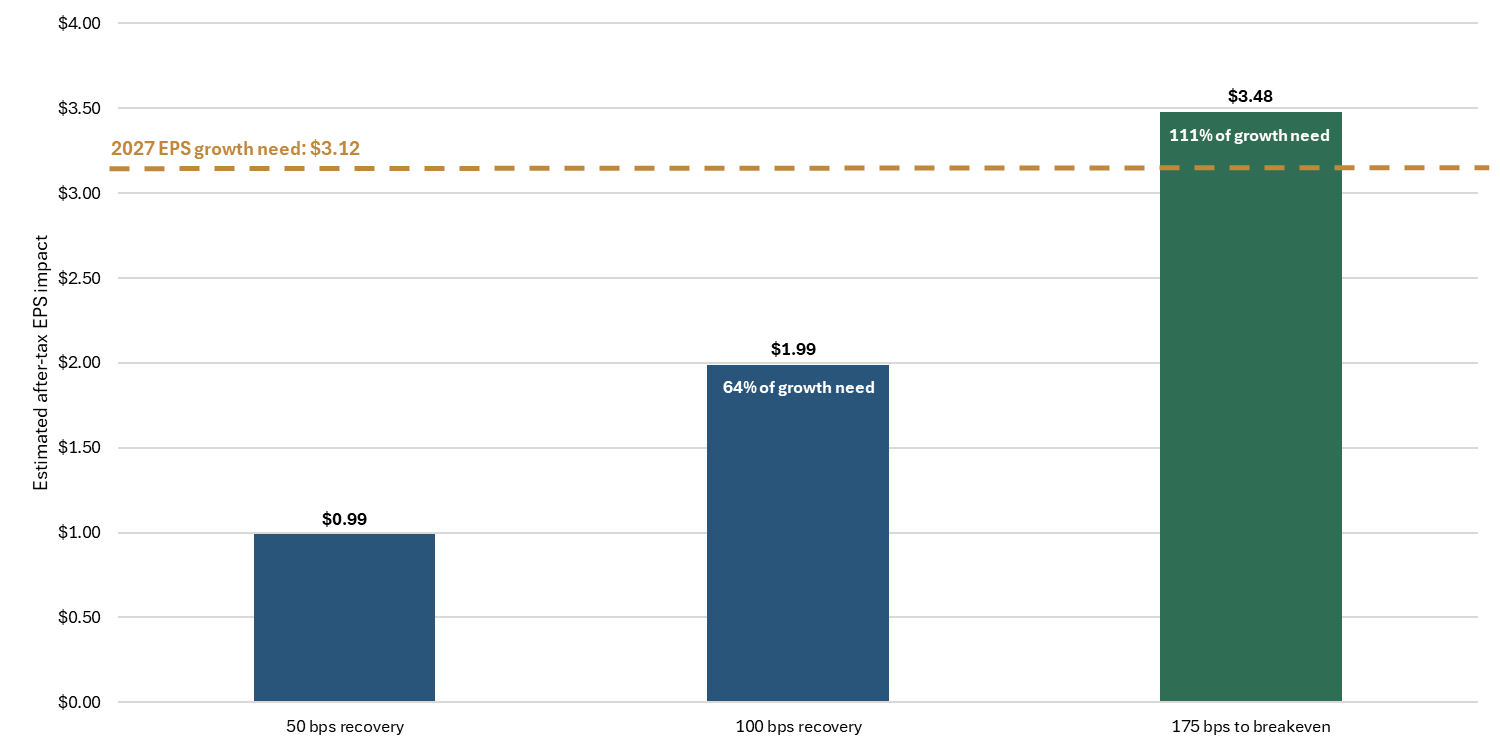
H1 Medicaid operating revenue was $28.72 billion, or a $57.45 billion annualized run rate. On that base, 50 basis points of margin recovery equates to approximately $287 million of operating income and $0.99 of after-tax EPS. A 100-basis-point recovery would contribute roughly $1.99 of EPS, or 64% of the $3.12 increase needed to reach the $29.12 floor. Full recovery from negative 1.75% to breakeven would be worth approximately $3.48 of EPS before considering revenue changes, market exits, or reinvestment. That is not our forecast, but it shows the scale of the embedded earnings drag — and the potential leverage if the turn materializes.
MA and ACA improved; Carelon was steady
Medicare Advantage. The deliberate 2026 portfolio reset is working. Favorable membership mix, better claims experience, and a greater concentration in D-SNP and HMO products generated roughly half of the quarter’s $0.50 operating outperformance. ELV remains on track for at least a 2% MA operating margin in 2026.
Individual ACA. The other half of the operating upside came from Individual ACA. A heavier mix of bronze plans produced more favorable early-year seasonality, and final 2025 CMS risk-adjustment results were better than estimated. ELV re-established the vast majority of that prior-year favorability in its 2026 accrual rather than extrapolating it, which explains why the quarter’s face-value upside did not flow through fully to guidance.
Carelon. Revenue increased 6.3% to $19.2 billion and operating gain increased 1.3% to $0.9 billion, while margin declined 30 basis points to 4.9%. CarelonRx benefited from specialty-pharmacy profitability, while Carelon Services continued to absorb investment as newer risk-based programs scale. The segment remains an important 2027 lever, but 2Q26 was steady rather than thesis-changing.
The stock reaction was a multiple reset, not an estimate reset
ELV entered the print with a demanding setup. Shares were up 30.1% from the April 21 close through July 14, versus 6.8% for the S&P 500 and 8.5% for XLV. The stock then fell 8.5% on July 15 and another 4.5% on July 16 before finishing essentially flat on July 17—a cumulative decline of 12.6% from the pre-print close.
Estimate revisions, however, were modest and positive—broadly consistent with the $0.25 guidance increase. Bloomberg consensus for 2026 EPS has risen $0.19 to $27.09, while 2027 consensus has increased $0.23 to $29.50. That disconnect indicates that the selloff was a multiple reset driven by execution risk and reduced earnings visibility, not a material reduction in expected earnings. That is the most important market message from the event.
Our take
We view 2Q26 as a fundamentally better quarter than the stock reaction implies, but not as proof that the Medicaid turn has arrived. The normalized EPS beat, MA progress, ACA execution, stronger Medicaid rates, and higher cash-flow guide are all constructive. Against that, the unchanged negative 1.75% Medicaid margin, the absence of assumed second-half cost-trend improvement, and the planned market exits keep the central earnings-quality debate unresolved.
The selloff reset the burden of proof. If second-half Medicaid margins improve as rates flow through, the $26 recurring baseline should support the $29.12 2027 floor and the current valuation could prove too punitive. If rate gains continue to be absorbed without visible margin progress, the market will question not only Medicaid’s recovery, but also how much of the 2027 algorithm must be supplied by Carelon, expense efficiency, and capital deployment.
What we are watching. The key evidence points are the 3Q26 Medicaid margin, the exit rate entering 2027, the scope of planned market exits, the durability of MA’s at least 2% margin, and measurable benefits from the one-time investments.