

HCA 2Q26: HIX Pressures Drive a Broader 2H26 Reset
HCA correctly forecast the 15% exchange-volume decline; the near one-for-one shift to uninsured was the surprise. Revised guidance implies 2H26 adjusted EBITDA declines 0.8% y/y.
Bottom line. The core theme of HCA’s 2Q26 earnings and guidance update was the economics of the 15% decline in same-facility health insurance exchange (HIX) equivalent admissions. HCA correctly forecasted the decline, but incorrectly forecasted where HIX patients would end up. HCA had assumed some of these patients would shift into other forms of insurance coverage, primarily employer-sponsored coverage, where economics are most favorable for hospitals. Instead, HIX patients migrated almost one-for-one into uninsured/self-pay, where economics are least attractive. The important distinction here is that aggregate volume was largely preserved, while payer and service mix deteriorated. The HIX miss directly contributed to HCA’s guidance cut, but does not fully explain it. HCA’s 2H26 EBITDA guidance midpoint now implies a 0.8% y/y decline.
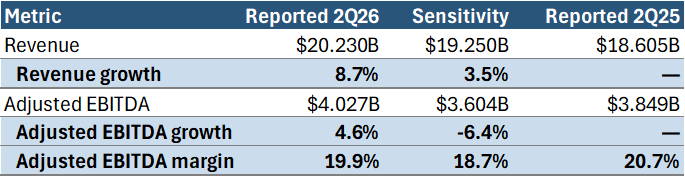
In the quarter specifically, it’s important to note that HCA’s $4.027B adjusted EBITDA included a $543M Florida Medicaid directed-payment program (DPP) benefit. $423M of that benefit was related to pre-2026 periods. Deducting the full $423M pre-2026 benefit would reduce adjusted EBITDA to $3.604B, nearly 9% below pre-print FactSet consensus. This is a one-sided sensitivity, not a clean normalized comparison.
THC experienced similar patient migration from HIX to uninsured in its quarter. It also experienced similar inpatient surgery case softness and professional fee pressure, but was able to raise 2026 adjusted EBITDA guidance. The takeaway for HCA is that the pressures it felt are at least partly industry-wide, but the resulting EBITDA guidance cut was not necessarily inevitable.
HCA called volumes correctly, but got the economics wrong
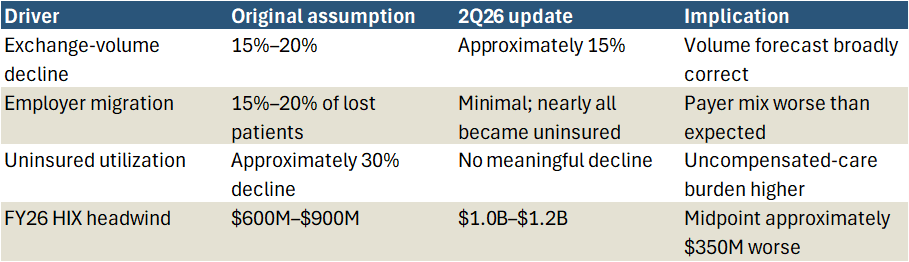
HCA initially assumed 15%–20% HIX volume attrition for 2026. Of that 15%–20% decline, management further assumed that 15%–20% of affected patients would migrate into employer-sponsored insurance coverage, where hospital economics are generally most favorable, including relative to HIX. HCA also assumed the remainder of affected patients would become uninsured, and that uninsured utilization would fall approximately 30%. Ultimately, HCA estimated that these assumptions would result in a $600M–$900M FY26 HIX headwind, which it intended to partly offset with a $400M “resiliency contribution” (i.e., an enterprise-wide efficiency program). HCA management continued to express confidence in this original framework at multiple intra-quarter conferences all the way through May.
Same-facility HIX equivalent admissions ultimately declined 15% y/y, which was within HCA’s original 15%–20% range. However, the migration of those patients was nearly one-for-one into uninsured (i.e. not 15%–20% into employer-sponsored) and the anticipated utilization reduction did not occur (i.e. not a 30% decline). In total, HCA estimated a $400M 2Q26 HIX headwind inclusive of a $75M upward revision to its original 1Q26 headwind estimate. Graver Research estimates this implies HIX headwinds of $225M in 1Q26 and $325M in 2Q26, or $550M for 1H26—approximately 61%–92% of HCA’s original full-year estimate. As a result, management increased its FY26 HIX headwind estimate from $600M–$900M to $1.0B–$1.2B. At the midpoint, the 2H26 headwind is roughly equal to 1H26, while the implied 3Q26/4Q26 quarterly amount is modestly below 2Q26; at the high end, it equals 2Q26.
Again, it’s important to make the distinction that this reset was principally a coverage-economics miss, and not evidence that patient demand has disappeared. HCA’s admissions, equivalent admissions, and ER visits all strengthened in the quarter. Commercial equivalent admissions excluding HIX also grew 2.4% in the quarter. Still, the HIX migration is not the sole explanation for HCA’s weaker underlying performance as inpatient and outpatient surgeries declined 2.3% and 3.4% in the quarter, respectively. On the call, HCA management acknowledged broader affordability pressure on elective procedures and said HIX was a ‘big piece’ of the surgery declines, but could not quantify the relative contributions despite repeated analyst questions.
Exhibit 1: HCA’s Original 2026 Exchange Assumptions Versus the 2Q26 Update
Weaker 2H26 implied guidance is now the core HCA debate
With the 2Q26 report HCA tightened its adjusted EBITDA guidance range by $200M and lowered the midpoint by $250M, or 1.6%. The revenue guidance range was tightened by $1B, but the midpoint remained unchanged, resulting in an approximately 32 bps decline in the adjusted EBITDA margin midpoint. Diluted EPS guidance is now $0.70, or 2.3%, lower at the midpoint. For the full year, the adjustment points to lower earnings conversion rather than lower revenue expectations. When isolating for the implied 2H26 guidance revenue and EBITDA performance starts to look weaker - more on that later.
The 2Q26 call provided some important details underlying the headline revenue and adjusted EBITDA guidance range revisions. The revised HIX headwind assumption is ~$350M worse at the midpoint, while the assumption for Medicaid supplemental payments improved by ~$550M. The net of those two changes produces a $200M benefit; however, the adjusted EBITDA midpoint was lowered by $250M. This implies another ~$450M of residual headwinds for the full year. Management described that residual as roughly $500M of broader growth moderation but did not decompose it despite a direct analyst question. Surgical mix, professional fees and weaker operating leverage are plausible contributors; whether the full $400M resiliency contribution remains intact is an open question.
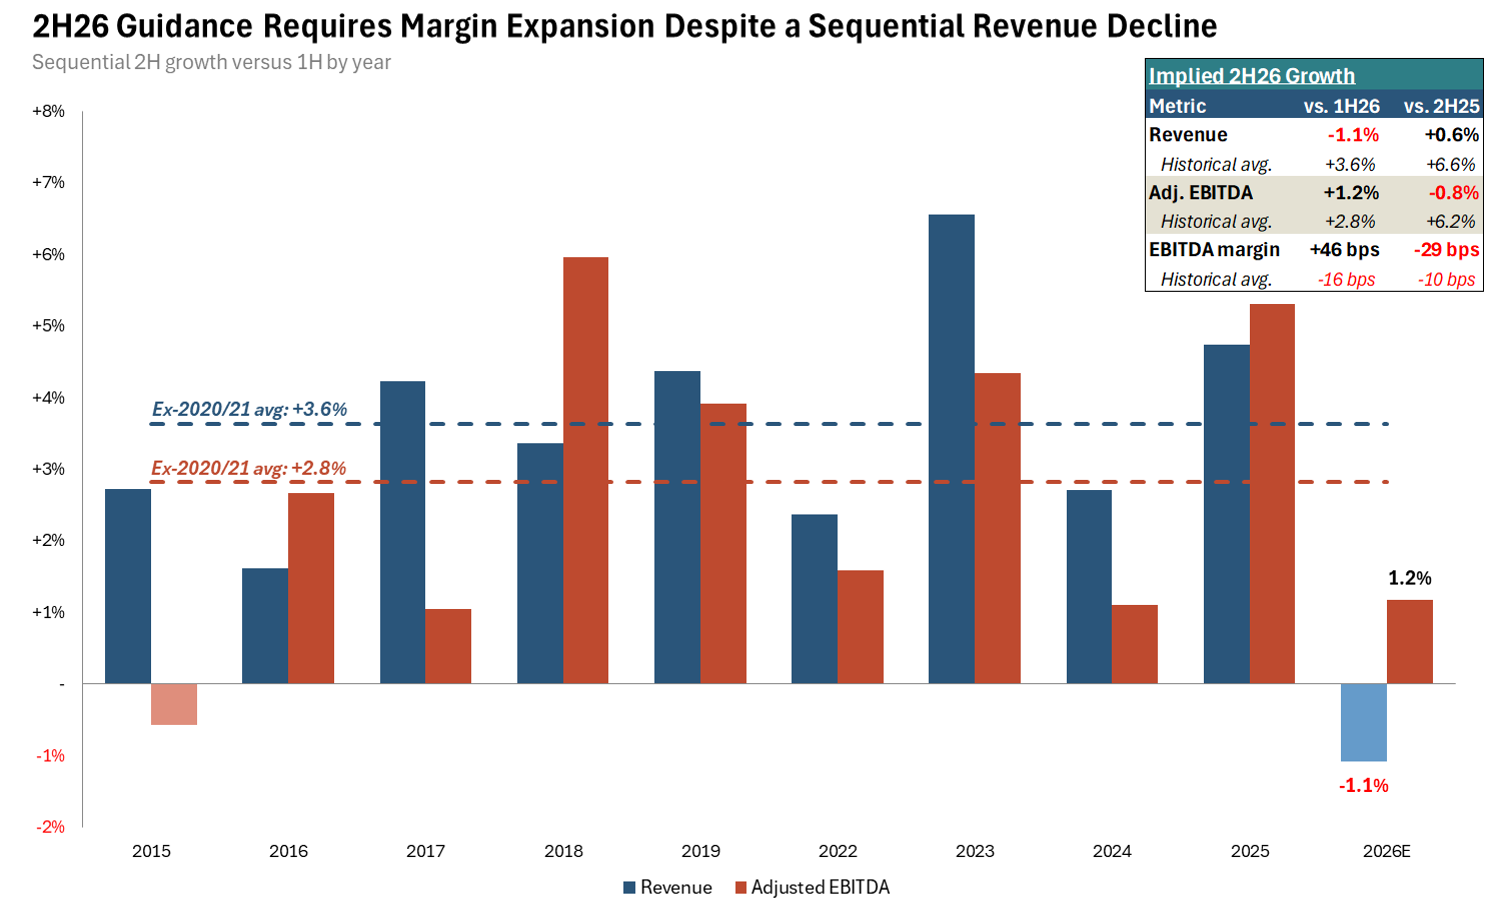
1H26 adjusted EBITDA totaled $7.829B on revenue of $39.339B. The revised guidance midpoints therefore imply $7.921B of 2H26 adjusted EBITDA on $38.911B of revenue. That implies particularly weak revenue and EBITDA performance in the back half of this year and will start to raise questions about 2027 performance. Excluding 2020–2021, 2H revenue has exceeded 1H in every year since 2015. Reported 2H26 revenue would be the first exception, declining 1.1% versus 1H26; however, 1H26 includes $980M of revenue attributable to pre-2026 Florida program periods. The midpoint also implies 2H26 y/y revenue growth of just 0.6%, a nearly 600 bps slowdown vs the 6.5% 1H26 revenue growth performance. At the midpoint 2H26 adjusted EBITDA is expected to fall 0.8% y/y. On a reported basis, guidance surprisingly implies 1.2% adjusted EBITDA growth and 46 bps of margin expansion in 2H26 versus 1H26. Excluding 2020–2021, 2H adjusted EBITDA margins have declined by an average 16 bps versus 1H since 2015, although the Florida catch-up distorts the 2026 sequential comparison. That discrepancy will create questions for investors. HCA management is strong, but has it provided enough cushion in the new guidance to avoid another cut?
Exhibit 2: HCA’s Implied 2H26 Guidance Requires Margin Expansion Despite a Sequential Revenue Decline
How the Florida Medicaid program impacted the quarter
Turning to the 2Q26 performance specifically, revenue was $20.230B up 8.7% y/y. Adjusted EBITDA was $4.027B, up 4.6% y/y, while margin declined 78 bps to 19.9%. Revenue and EBITDA beat pre-print consensus estimates by 3.9% and 1.9% respectively, which was already known from the July 14 preliminary update. Adjusted EPS increased 11% y/y while adjusted net income only increased 2.1%, with the share count decline providing substantial support.
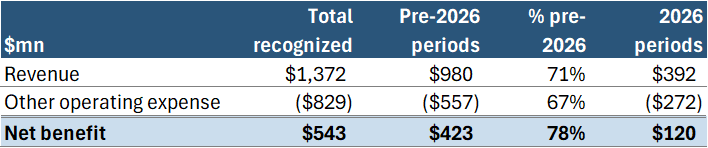
The quarter’s reported performance was supported by HCA’s recognition of $1.372B of Florida program revenue. That included $829M of related program expenses, resulting in a $543M adjusted EBITDA benefit for the quarter. Of the totals recognized, $980M, or 71%, of revenue and $423M, or 78%, of the net benefit were related to pre-2026 periods. It’s important to note that the program is a core and ongoing part of its business, and what is being highlighted here is just the period-attribution and catch-up timing. That said, these sort of out-of-period payments can be common with state Medicaid supplemental payment programs which have grown significantly in recent years as a whole and as a percentage of hospital reimbursement. As these programs have grown, it has made isolating pure in-quarter performance and y/y compares more difficult.
Even so, creating sensitivities around performance by removing the out-of-period portions of these payments is still a useful exercise. Removing only the pre-2026 net benefit of $423M produces approximately $3.604B of 2Q26 EBITDA, an 18.7% margin, and a 6.4% y/y EBITDA decline. Mechanically allocating the full $980M to same-facility revenue would lower revenue per equivalent admission growth from 6.4% to approximately 1.2%; however, HCA did not disclose the precise same-facility allocation. To be clear, these calculations are not “normalizations,” but sensitivities. A full normalization would also require adjusting 2Q25 for unquantified retrospective Medicaid supplemental-payment benefits and accrual timing, which cannot be done cleanly given current disclosures. However, we can conclude that while the headline figures for the quarter overstate momentum, the sensitivity analysis performed here also does not establish a precise normalized underlying growth rate– the truth likely lies somewhere in between.
Exhibit 3: Most of Florida’s 2Q26 Benefit Was Related to Prior Periods
Panel A: Florida program recognition recorded in 2Q26
Panel B: Pre-period-excluded 2Q26 sensitivity
Volumes held up, but worse mix negatively impacted earnings
2Q26 same-facility admissions grew 2.5%, equivalent admissions grew 2.7%, and ER visits grew 3.6%. That represents acceleration from 0.9%, 1.3%, and 0.3% in 1Q26, respectively. Commercial equivalent admissions excluding exchanges also increased 2.4% in the quarter. All of this supports HCA’s claim that demand remains healthy at a broad level.
The issue is that, within that broader demand, the underlying mix of services has weakened. Same-facility inpatient surgery cases declined 2.3%, and outpatient surgery cases declined 3.4%. Surgery cases are generally one of, if not the, most important revenue and profit drivers for hospitals, so the decline is an important trend to monitor. Looking deeper, 1H26 elective inpatient surgery cases fell approximately 6%, while emergent surgery cases increased 2%. Roughly 90% of outpatient surgery cases are elective. Management said lost exchange volume was a ‘big piece’ of the surgery weakness but could not separate it from broader affordability pressure.
As stated previously, HIX equivalent admissions declined 15% while uninsured volumes increased by approximately 15%. Uninsured patients now represent more than 10% of equivalent admissions, compared to 6.8% for HIX patients. That one-for-one patient switch at similar service levels creates substantially worse reimbursement and collection economics for HCA. Contracted rate and government update benefits helped offset some of that pressure, but again the Florida program accounting obscures reported revenue intensity.
When considering Medicaid supplemental-payment programs, management said same-facility cost per equivalent admission was approximately flat y/y and improved 1.4% sequentially. Salary and supply growth remained controlled, however professional fees, which reside in the other operating expense line item, increased 8.5%. That increase was primarily led by anesthesia and radiology, after roughly 10% 1H26 growth. Core labor and supply trends were controlled, but mix and professional fees limited operating leverage in the quarter and first half of the year.
THC confirms the mix pressures, but had more cushion and levers to pull
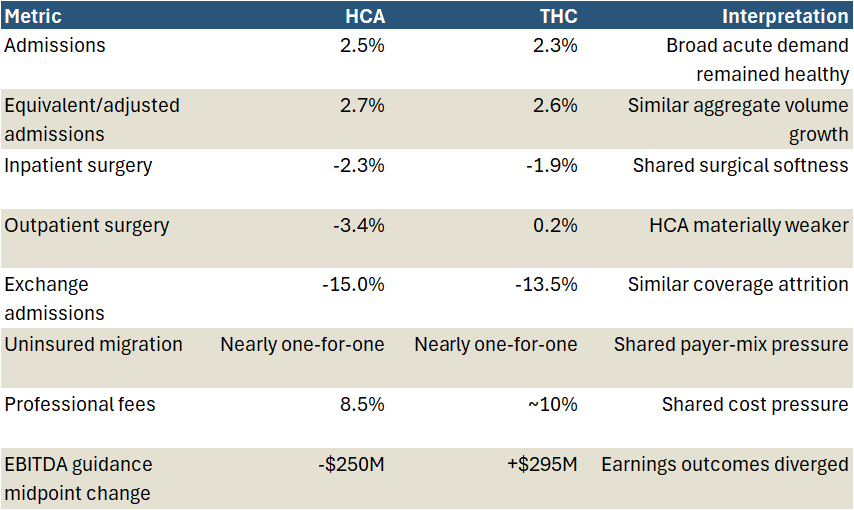
THC reported same-hospital admissions growth of 2.3% and adjusted admissions growth of 2.6%. Management also said Hospital-segment HIX admissions declined 13.5%, with approximately 80%–100% of the lost volume migrating to uninsured. Same-hospital inpatient surgery cases fell 1.9% and it also saw professional fees increase approximately 10%. THC corroborated the principal demand, coverage/mix dynamics, and cost pressures described by HCA, but the EBITDA performance at least versus consensus expectations and prior guidance was materially better.
THC reported 16.3% consolidated EBITDA growth and 22.3% hospital-segment EBITDA growth, with hospital margin expanding 240 bps y/y. It also raised EBITDA guidance by $295M at the midpoint. Even after deducting the full $92M prior-period Medicaid benefit, THC’s adjusted EBITDA would remain approximately 6.3% above consensus and 8.1% above reported 2Q25. That is all in stark contrast to HCA’s $250M reduction to its EBITDA guidance at the midpoint.
To be fair to HCA, THC has significant exposure to USPI, its ASC business, different geographies, and different exchange concentration. It also uses different definitions for key items and different Medicaid accounting. The real conclusion here is that the hospital environment alone did not dictate HCA’s outcome, but its exposures, starting assumptions, service mix, and expense conversion mattered greatly.
Exhibit 4: HCA and THC 2Q26 Operating Comparison
What matters from here
HCA closed July 24 up 1.5%, but still down 2.2% since just before the preliminary update and guidance cut were announced on July 14. The final figures in the report matched the preliminary update. The one-day positive move with the full report on July 24 likely came from a mix of relief that no further cut emerged, improved clarity on the moving pieces, and potentially some THC sympathy.
What matters most from here is: gaining a better understanding of the composition of the $450M–$500M residual reduction to EBITDA guidance; whether the $400M resiliency contribution remains intact; HIX and uninsured mix and service intensity/utilization; progression of elective surgery cases; and evidence supporting 4Q26 growth over 3Q26 and the right 2027 exit rate or jump-off. Further 2027 exchange attrition and potential impacts of Medicaid work requirements will also start to come into focus as we move through the year. For now, long-term demand appears to remain intact, but near-term confidence in earnings conversion and management’s recovery cadence has weakened.