

Healthcare Services Coverage Map: The Initial Universe and Key Debates
A launch-edition map of the companies, subsectors, and debates Graver Research will track across healthcare services.
Why Graver Research exists
Graver Research exists to bring the discipline of professional equity research to a broader and more accessible format.
The goal is to apply the same core habits that make institutional research valuable — clear coverage universes, explicit debates, evidence-based company analysis, industry context, earnings and policy read-throughs, and a disciplined focus on what can change the narrative — while publishing in a format that is useful to both investors and healthcare services professionals.
Traditional equity research is often written for institutional clients and distributed through enterprise relationships, banking platforms, and sales channels that most serious readers cannot access regardless of interest or willingness to pay. Graver Research is built around a different model: independent, sector-focused research that is more accessible, more flexible in format, and designed for readers who want to understand how healthcare services companies, policy, reimbursement, utilization, and market expectations fit together.
Some of the topics, terms, and business models in healthcare services are complex and highly specific. The core product is written for industry and healthcare investment professionals, but Graver Research will also publish primers and explainers for readers who are newer to the space or want a clearer foundation.
Why this map exists
This “Healthcare Services Coverage Map” note is intended to be both the initial launching point for Graver Research and serve as a key regularly updated reference piece for subscribers. The map defines the Graver Research coverage universe and what subscribers should expect to receive on an ongoing basis. It also outlines the key company and subsector debates, and creates a baseline for future updates as earnings, policy developments, industry data, and market narratives change.
This piece does not serve as a full initiation or valuation framework for the coverage universe. Going forward, Graver Research will publish a mix of company notes, sector signals, policy and regulatory read-throughs, data snapshots, earnings/event notes, and recurring coverage maps. The common thread will be the same: identify the debates that matter, connect company fundamentals to industry and policy context, and update the view as the facts change.
What “healthcare services” means
Healthcare services is often used as a catch-all label for the parts of the healthcare industry that are not biopharma, medical technology, or life sciences tools. Those categories are often centered on products: drugs, devices, diagnostics, equipment, or research inputs. Healthcare services is different. It is more about systems, infrastructure, payment flows, care delivery, distribution, administration, outsourcing, and execution.
That makes the category broad and sometimes imprecise. A managed care company, a hospital operator, a drug distributor, and a clinical research organization all sit in different parts of the healthcare value chain. They have different customers, margin structures, regulatory exposures, capital intensity, and earnings drivers. But they share a common feature: each helps determine how healthcare is financed, accessed, delivered, administered, or supported.
In that sense, healthcare services is the operating layer of the healthcare system. It includes the companies that insure members, manage medical cost risk, contract with providers, deliver care, distribute drugs, process claims, run networks, support clinical development, manage data, and help large healthcare organizations function. The sector is where policy, reimbursement, utilization, labor, contracting, local market structure, and corporate execution show up most directly in public company fundamentals.
That is also what makes the sector difficult to analyze as one simple group. The key variables for a Medicare Advantage payer are not the same as the key variables for a hospital operator or pharmaceutical distributor. A utilization trend that pressures one subsector may benefit another. A reimbursement change may matter differently depending on payer mix, geography, customer concentration, or the ability to reprice risk. The same healthcare headline can therefore produce very different business implications across the group.
The initial coverage universe
Graver Research will begin with an initial coverage universe of 10 public companies that are among the most important for tracking the broader narratives, earnings debates, and policy implications across healthcare services.
This list is not meant to be exhaustive. The broader public healthcare services universe includes more than 100 companies across managed care, providers, distribution, services, technology, outsourcing, diagnostics, post-acute care, physician enablement, and adjacent areas. Graver Research will follow that broader universe where relevant, but the goal of the initial coverage list is to create a focused anchor group that can be covered consistently and thoughtfully.
The starting universe spans four major subsectors: managed care, hospitals, healthcare distribution, and CRO / outsourcing. These groups represent a large share of public healthcare services market capitalization and sit at the center of many of the sector’s most important current debates: medical cost trend, Medicare Advantage economics, Medicaid and ACA normalization, hospital volume and labor dynamics, specialty distribution growth, capital allocation, biopharma outsourcing demand, and the relationship between policy change and company-level earnings power.
Over time, this universe will likely broaden and evolve. Companies may be added as new debates become more important, or as adjacent subsectors deserve more dedicated coverage. For now, these 10 companies provide a practical starting point: large, liquid, strategically relevant businesses that together offer a useful lens into the state of healthcare services.
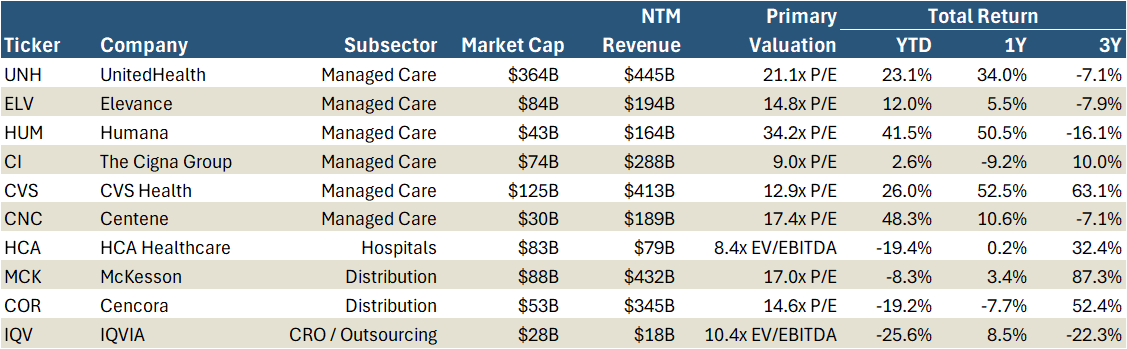
Exhibit 1 below provides a simple starting snapshot of the initial coverage universe: Market Capitalization, forward revenue, primary valuation, and recent total return performance.
Exhibit 1: Coverage Universe Snapshot
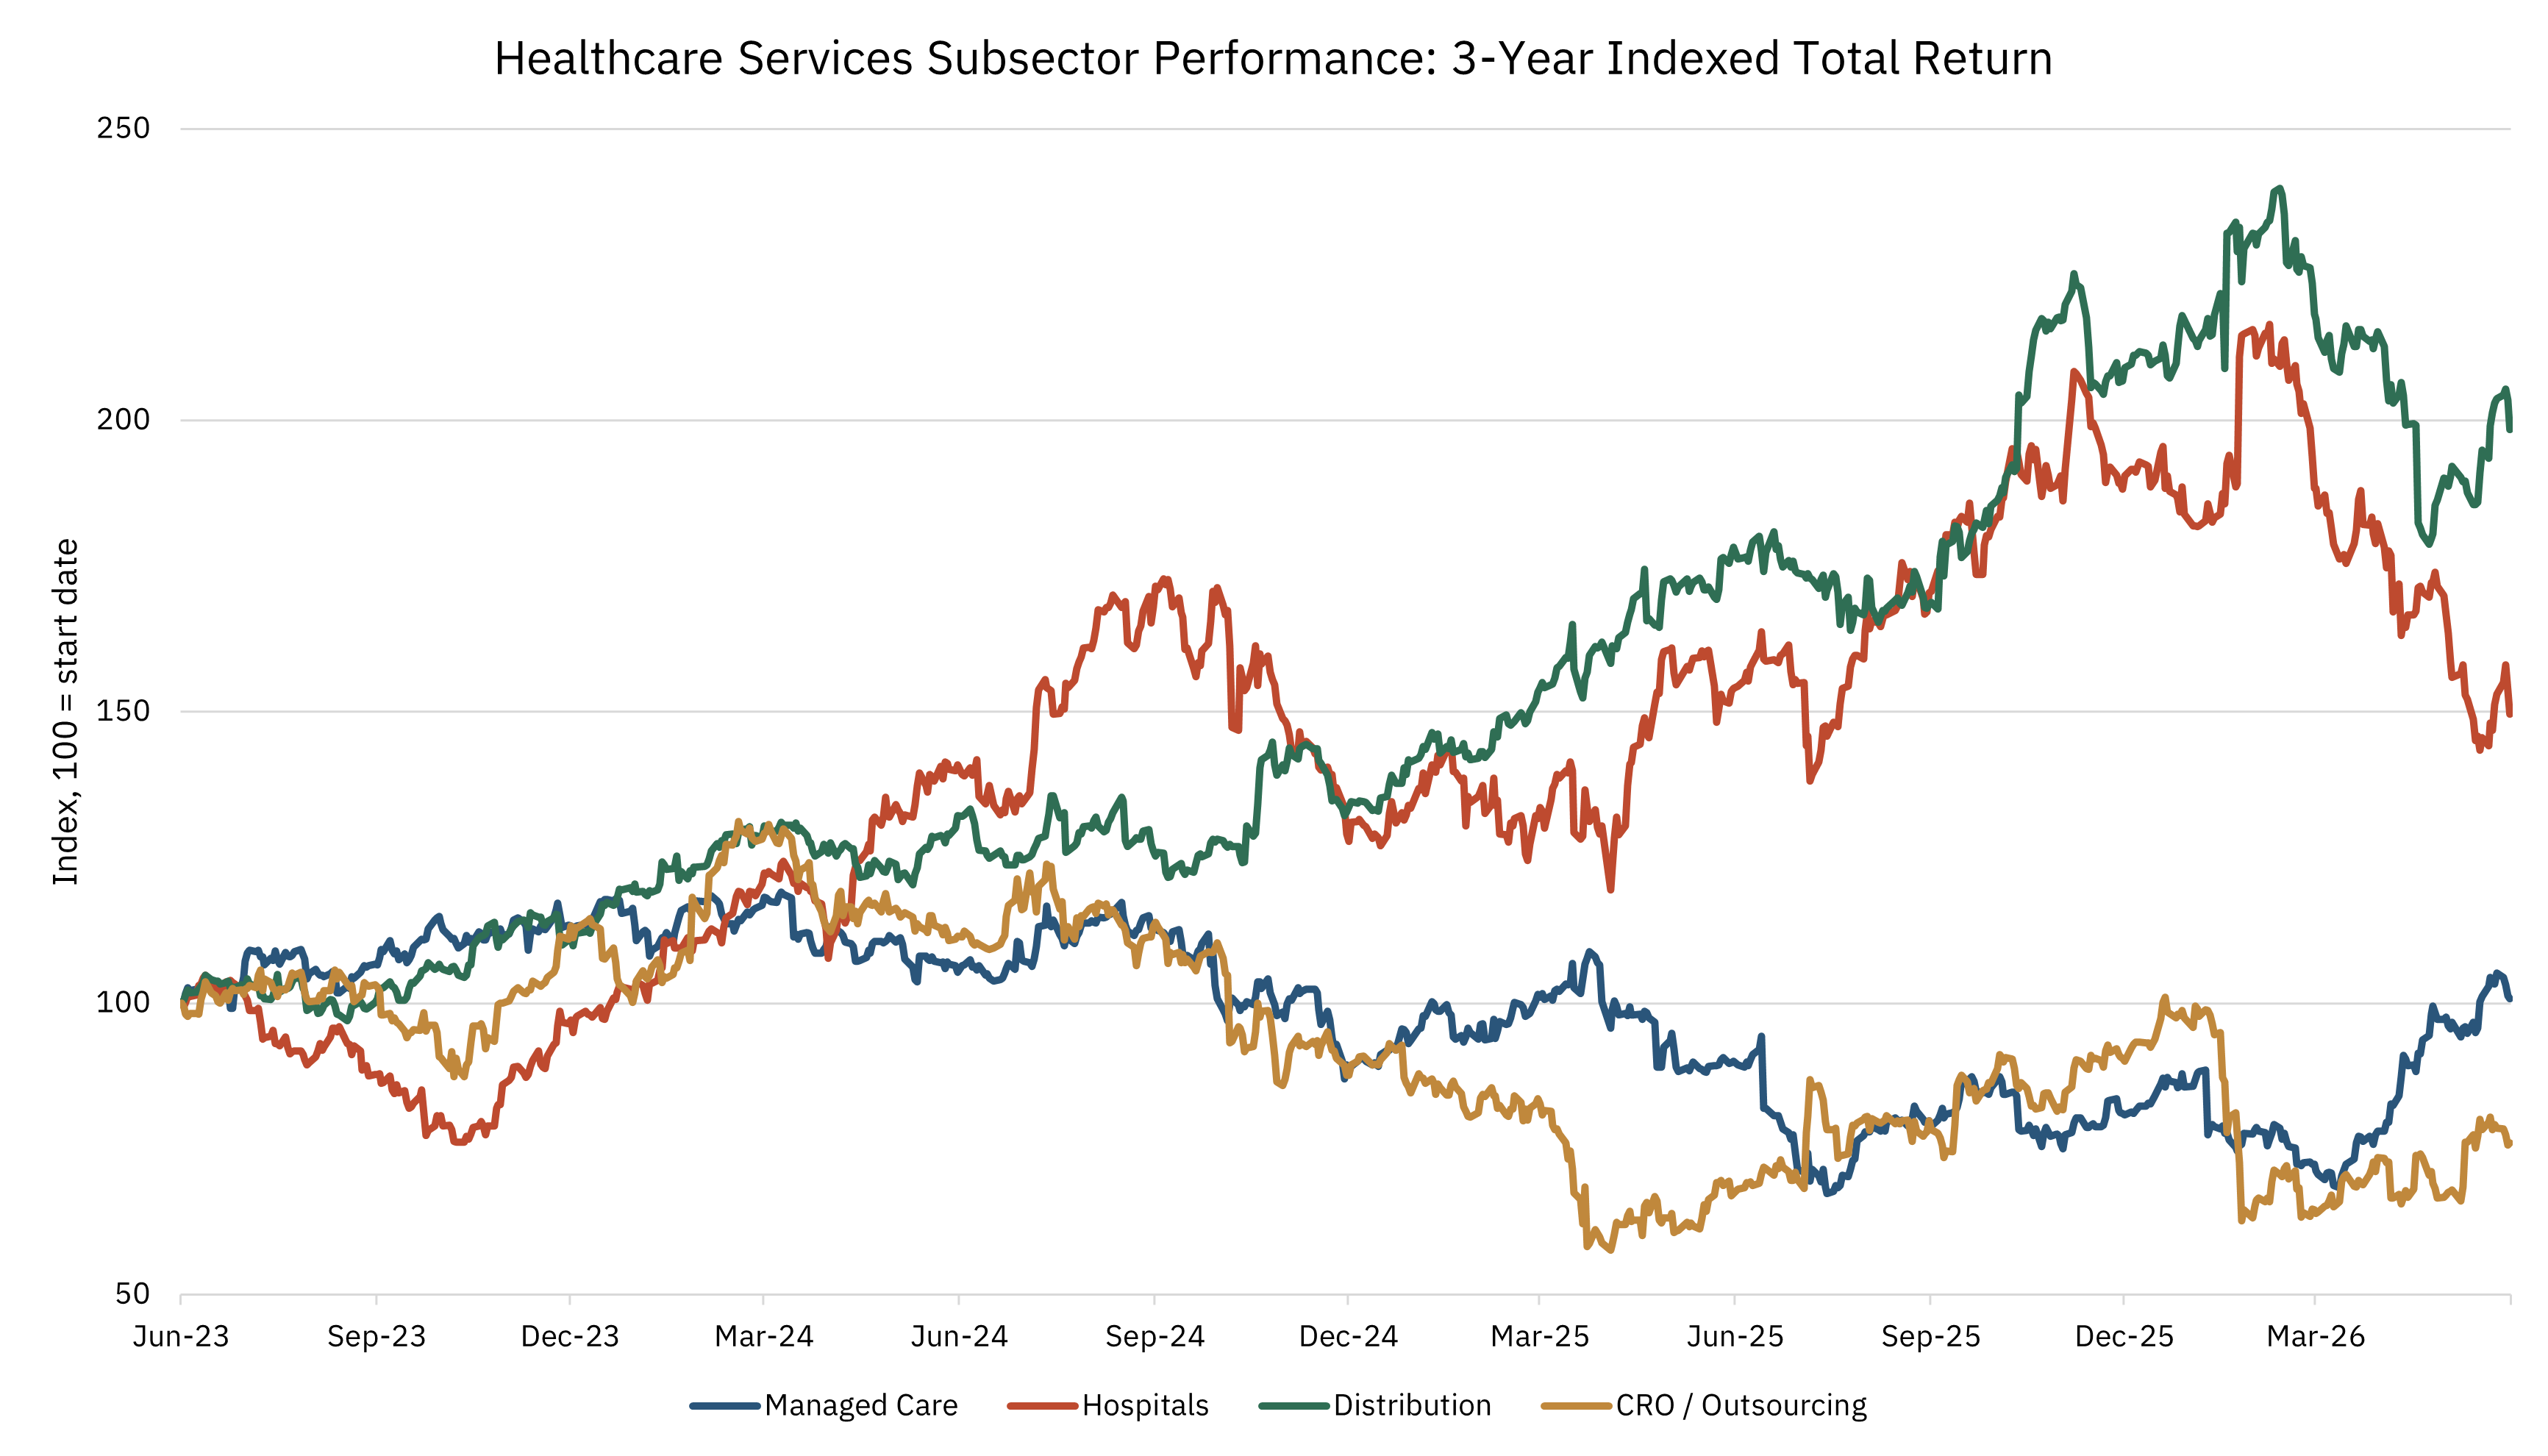
How the subsectors have traded
Healthcare services does not trade as one unified group. The divergence is clear in Exhibit 2 below, and it reflects a broader point about the sector: different subsectors can be exposed to the same underlying healthcare driver in very different ways.
Utilization is a simple example. Rising healthcare utilization can be positive for hospitals if it supports volumes, acuity, and operating leverage. It can be positive for distributors if it flows through prescription or specialty drug volumes. It can be negative for managed care companies if medical cost trend is underpriced or emerges faster than rates and benefit design can adjust. For CROs and outsourced services companies, near-term stock performance may have less to do with medical utilization and more to do with biopharma funding, backlog conversion, and customer spending cycles.
Even that framing is too static. These relationships can change over time depending on pricing, policy, contract structure, payer mix, market expectations, and the starting point for each stock. A driver that looks like a headwind in one period can become manageable if it is repriced. A favorable end-market trend can still disappoint if expectations were too high. As with any public company, the market reaction is rarely just about the direction of the driver; it is about the driver relative to expectations.
That is why healthcare services needs to be analyzed by subsector and company-specific debate, not as a single monolithic category. Performance can diverge sharply across managed care, hospitals, distribution, and CRO / outsourcing. It can also vary meaningfully within a subsector. In managed care, for example, exposure to commercial risk, Medicare Advantage, Medicaid, ACA marketplaces, PBMs, and care delivery assets can lead to very different earnings sensitivities and investor debates.
Exhibit 2 shows how the four initial subsectors covered by Graver Research have performed over the past three years. The baskets use a broader group of stocks than the initial 10-company coverage universe in order to better represent subsector-level performance. The constituents are listed in the caption below the chart.
Exhibit 2: 3-Year Indexed Total Return by Subsector
The key company debates
Each company in the initial coverage universe has a different setup. Some are working through utilization and reimbursement resets. Others are trying to prove the durability of specialty growth, PBM model changes, vertical integration, or biopharma demand recovery. Even within the same subsector, the stock debates can be very different.
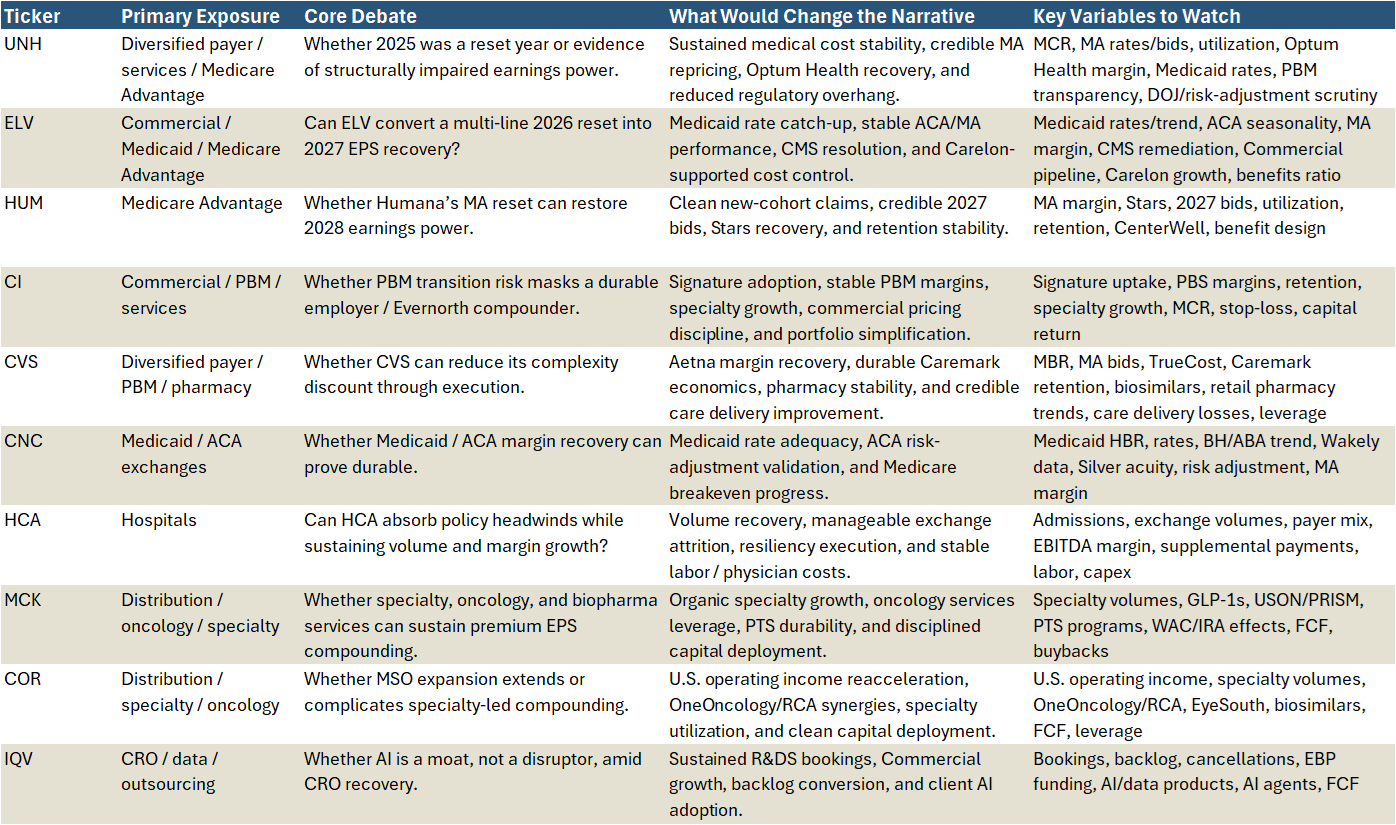
Exhibit 3 below is meant to track the current narrative for each company. The goal is to identify the live debate, the evidence that could change investor perception, and the key variables that should matter most over the next several quarters.
Future company specific notes will go deeper on each of these debates, beginning with UNH.
Exhibit 3: Coverage Debate Tracker
The subsector setup
The initial coverage universe spans four broad subsectors: managed care, hospitals, distribution, and CRO / outsourcing. Each group sits in a different part of the healthcare services value chain, but each is exposed to the same broad question: how do changes in utilization, reimbursement, policy, market structure, and customer behavior flow through to company-level earnings power?
Managed Care
Managed Care is the largest and most complex debate. The group is working through overlapping resets in Medicare Advantage, Medicaid, ACA marketplaces, PBM transparency, commercial pricing, vertical integration, and public / regulatory scrutiny. The central question is whether 2025 and 2026 represent a painful but manageable reset, or whether normalized earnings power is structurally lower than investors previously assumed.
Medicare Advantage is the most visible pressure point. HUM is the purest test because its recovery depends heavily on Stars, benefit design, utilization, retention, and the ability to rebuild MA margins over the next several years. UNH and CVS also have meaningful MA exposure, but their debates extend into broader platforms and services. Medicaid and ACA add another layer. ELV and CNC are the clearest examples of companies trying to show that rate catch-up, cost management, repricing, and risk adjustment can restore margins after a period of elevated trend and morbidity pressure. CI provides the counterpoint: a more employer-focused and asset-light services driven model where the debate is less about government-program funding and more about PBM transition, commercial discipline, specialty pharmacy, and capital return.
Across the group, the most important question is whether managed care companies can still price, design benefits, manage cost, and adapt fast enough to protect long-term earnings power in a more difficult utilization and policy environment.
Hospitals
Hospitals have a different setup. Utilization is generally a positive driver when it supports admissions, acuity, operating leverage, and commercial revenue. HCA is the clearest hospital benchmark because it combines scale, strong local-market networks, disciplined capital allocation, outpatient expansion, and a long track record of cost control. The debate is not whether HCA is a high-quality operator. It is whether even a high-quality operator can fully absorb policy and payer-mix pressure.
ACA exchange attrition can reduce volumes, shift patients toward uninsured status, pressure collections, and change utilization patterns. Supplemental payments can offset some of that pressure, but they are variable and difficult to underwrite. Labor and hospital-based physician costs also remain important. The hospital setup is therefore a balance between attractive core demand and the reality that coverage, reimbursement, and payer mix can still materially influence reported earnings.
Distribution
Distribution is no longer just a low-margin drug logistics story. MCK and COR both show how scale distribution is becoming a foundation for specialty-enabled healthcare services. Specialty drug utilization, oncology innovation, GLP-1s, biosimilars, health-system services, provider relationships, biopharma services, workflow tools, and capital allocation are now central to the debate.
MCK represents the cleaner specialty-led compounder, with oncology, multispecialty, CoverMyMeds, biopharma access services, data, and portfolio simplification supporting the growth story. COR is making a more direct move into specialty physician infrastructure through OneOncology, Retina Consultants of America, and EyeSouth. The key question for both is whether specialty services can sustain premium earnings growth after a strong period of execution, or whether growth normalizes as GLP-1 revenue, biosimilars, customer shifts, list-price changes, and acquisition contribution mature.
CRO / Outsourcing
Contract Research Organizations and Outsourcing is centered on biopharma demand recovery and AI. IQV is the primary lens because it spans clinical development, commercial outsourcing, real-world data, analytics, and life-sciences technology. The first question is whether large pharma decision-making and biotech funding are improving enough to support sustained bookings, backlog conversion, and revenue growth. The second is whether AI is a threat or a moat.
IQV is arguing that useful AI in life sciences requires proprietary data, compliance, domain expertise, and embedded workflows. If that is right, AI can become a revenue and margin opportunity. If not, parts of CRO, analytics, and consulting work could face pricing or automation pressure. That makes IQVIA the cleanest test of whether CRO / outsourcing can reaccelerate after several years of uncertainty.
What Graver Research will track
The goal is to understand which developments actually matter for normalized earnings power, competitive position, and long-term business value.
That requires combining multiple inputs. Company filings, earnings calls, investor presentations, and quantitative company data are the starting point. Industry data helps supplement and test management commentary. Conversations with operators, investors, consultants, and others across the healthcare ecosystem can help assess whether the public narrative matches what is happening in the field. My decade of experience following healthcare services companies over multiple cycles provides the context for separating signal from noise.
The research framework will focus on the variables that most often drive healthcare services fundamentals.
Utilization is one of the most important. Changes in admissions, procedures, pharmacy volume, acuity, care intensity, and site of care can create very different implications across subsectors. Higher utilization may be positive for hospitals or distributors, negative for managed care if underpriced, and less directly relevant for CROs in the near term.
Reimbursement and rate cycles are equally important. Medicare Advantage rates, Medicaid rate updates, commercial pricing, supplemental payments, exchange pricing, and manufacturer / distributor economics often determine whether cost pressure can be absorbed or repriced. Policy and regulation matter because healthcare services business models are deeply connected to government programs, payment rules, risk adjustment, PBM scrutiny, prior authorization, transparency requirements, and coverage policy.
Membership and enrollment will also be central, especially in managed care. Growth is not automatically good if it comes with worse morbidity, weaker retention, underpriced risk, or unattractive lifetime value. Payer mix matters for providers because a volume trend can look very different depending on whether it is commercial, Medicare, Medicaid, exchange, or uninsured.
Labor and capacity remain critical for facility-based care and care delivery businesses. Wage inflation, contract labor, physician costs, throughput, staffing models, and capital investment can determine whether revenue growth converts into margin. Medical cost trend is the managed care equivalent: the key question is not just whether cost trend is high, but whether it is understood, priced, managed, and reflected in expectations.
Across all subsectors, Graver Research will track contracting power, capital allocation, earnings quality, and valuation.
The objective is to build a disciplined research process around the variables that matter. Not every headline changes the story. The work is to identify which facts actually change the debate.
How this map will evolve
This coverage map is meant to be a starting point, not a static document. Graver Research will update it periodically as company fundamentals, subsector narratives, policy developments, and market expectations change.
The likely cadence will be quarterly, but the map may be updated sooner if the facts change materially. In healthcare services, narratives can move quickly: a rate notice, reimbursement update, utilization inflection, policy proposal, acquisition, or management change can alter the debate before the next formal reporting cycle.
Future versions may add companies, refine the subsector groupings, change the key variables being tracked, or reframe the central debate for individual names.
The next piece will move from the map to company-level work, beginning with UNH. That note will go deeper on one of the most important current debates in healthcare services: whether UNH’s recent reset is the beginning of a recovery in normalized earnings power or evidence of a more durable impairment.