

Bottom line. UHS provided the final major datapoint needed to complete the 2Q26 hospital quarter mosaic. The underlying drivers across HCA, THC and UHS were remarkably similar, but EBITDA guidance outcomes differed based on initial assumptions, margin runway and available offsets. UHS same-facility acute-care adjusted admissions increased 2.9% y/y, versus comparable HCA and THC measures of 2.7% and 2.6%, respectively. Each of the three hospital operators reported ~14%–15% HIX volume attrition and near one-for-one migration to self-pay/uninsured, although payer-volume disclosure bases are not fully standardized. Total surgery declined y/y on each company’s comparable-location basis. Professional-fee inflation also remained elevated across the group. Company-specific Medicaid supplemental payments continued to obscure within-company y/y and sequential comparisons. UHS’s adjusted EBITDA net-of-NCI midpoint and HCA’s adjusted EBITDA midpoint fell 1.9% and 1.6%, respectively; THC was the clear positive outlier with a 6.4% increase. The core conclusion is that hospital-sector pressures are real, still developing and already affecting earnings and guidance; divergence across the group reflects initial assumptions, remaining margin/cost-cutting runway and reimbursement offsets.
UHS: Mixed 2Q26 Results and a Guidance Reset
UHS reported consolidated revenue of $4.638B, +8.3% y/y and 1.3% above StreetAccount (SA) consensus. Adjusted EBITDA net of NCI was $677.9M, +5.4% y/y, but missed SA consensus by 0.5%. Adjusted EPS of $5.98 beat SA consensus modestly by 0.7%. Several specific or unusual—but not necessarily nonrecurring—items affected the quarter: (1) a $100M out-of-period Florida DPP benefit that had been quantified before the print and therefore was not a new investor surprise; and (2) a $28M professional/general liability reserve increase. 2Q25 also included ~$101M of incremental supplemental reimbursements. Comparable segment operations did not contract: same-facility acute-care and behavioral-health EBITDA excluding out-of-period benefits increased 6.3% and 5.7% y/y, respectively. However, excluding the Florida benefit, adjusted EBITDA net of NCI missed UHS’s internal expectations by ~$63M, reflecting $28M of liability expense, ~$20M from Laurel Ridge and ~$15M from Cedar Hill.
UHS reduced the adjusted EBITDA net-of-NCI guidance midpoint by $51.5M, or 1.9%; the adjusted EPS midpoint fell 2.6%, while the revenue midpoint increased 0.2%. The implied full-year adjusted EBITDA net-of-NCI margin midpoint fell ~30 bps, nearly identical to HCA’s ~32-bp reduction. At a high level, two major updates bridged prior guidance to the revised outlook: (1) approximately $150M of incremental Medicaid supplemental benefits; and (2) approximately $200M of new adverse items. Those adverse items included $50M from the Laurel Ridge/San Antonio behavioral-health facility, ~$30M from the reduced Cedar Hill/Palm Beach de novo tailwind, ~$50M of higher liability expense and ~$50M from lower same-facility volume assumptions and other changes. The HIX headwind also increased ~$10M to ~$85M, although management did not specify whether that amount was included in the final ~$50M bucket. Management’s disclosed adverse-item buckets do not fully reconcile to the rounded ~$200M total.
At the midpoint, guidance implies 2H26 revenue growth of 5.8%, a 0.9% decline in adjusted EBITDA net of NCI and ~94 bps of margin contraction, all y/y. That is weak reported EBITDA conversion, but supplemental-payment timing, Laurel Ridge and de novo economics distort the comparison. Management also expects support from new acute-care capacity, Cedar Hill improvement and moderating behavioral-health labor growth; the implied decline therefore is not a clean measure of underlying same-facility earnings.
UHS Lowers Volume Guidance; Mix Pressure Shows Across All Three
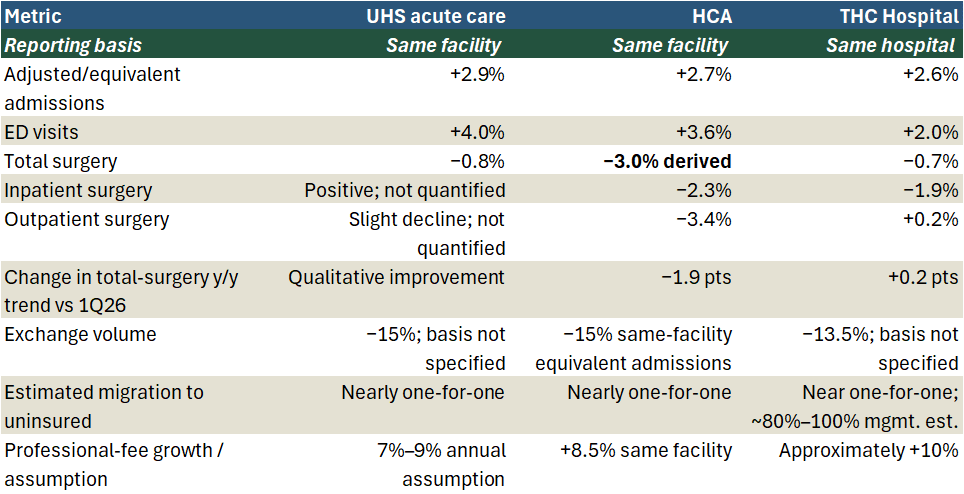
Aggregate patient traffic held up in the quarter: UHS same-facility acute-care adjusted admissions increased 2.9% y/y, versus comparable HCA and THC measures of 2.7% and 2.6%, respectively. ED visits increased 4.0% at UHS and 3.6% at HCA on a same-facility basis, and 2.0% at THC on a same-hospital basis. However, UHS reduced its full-year acute-care adjusted-admissions range to 1.5%–2.5% from 2.0%–3.0%, while 1H26 same-facility growth was only 1.4%.
HIX volume and migration patterns were broadly similar and clearly worsened payer mix, but the companies did not identify one common cause of weaker procedure mix. Company-reported UHS HIX volume declined ~15% y/y, versus comparable declines of ~15% at HCA and 13.5% at THC. All three also characterized close to one-for-one migration to uninsured or self-pay. To be clear, these disclosures are not fully comparable or standardized patient-level cohort studies. The narrow conclusion is that lost exchange coverage changed the payer category attached to encounters more than aggregate traffic, while worsening the economics.
Lower surgery volumes and higher professional fees also weighed on the quarter’s results for all three. Same-facility acute-care total surgery declined 0.8% at UHS, versus a 0.7% same-hospital decline at THC and a Graver Research-derived 3.0% same-facility decline at HCA. UHS said inpatient surgery increased and outpatient surgery declined slightly; THC reported inpatient surgery down 1.9% and outpatient surgery up 0.2%; HCA was again the negative outlier, with inpatient and outpatient surgery down 2.3% and 3.4%, respectively. Sequentially, HCA’s total y/y trend deteriorated approximately 190 bps, while THC improved 20 bps, and UHS reported qualitative improvement. Professional-fee pressure remained elevated: UHS said the 7%–9% annual increase embedded in guidance was consistent with its 2026 experience, while HCA reported 8.5% same-facility growth and THC reported ~10%.
Exhibit 1: Comparable-Location Patient Traffic Held, but Mix Deteriorated
HCA and UHS Guidance Bridges Differ Despite Similar Midpoint Cuts
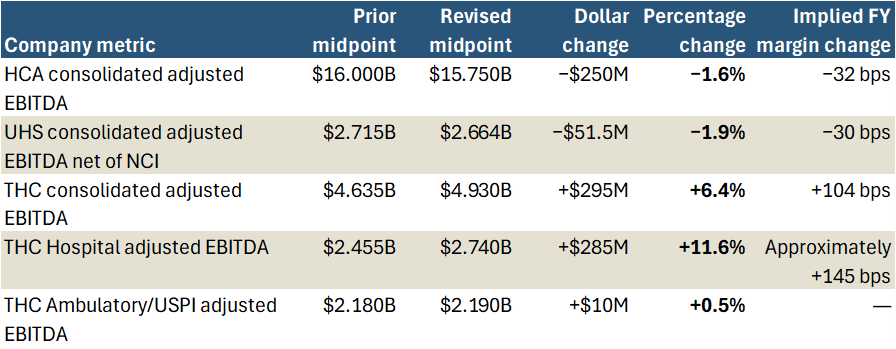
HCA reduced its adjusted EBITDA guidance midpoint from $16.00B to $15.75B, or 1.6%, while UHS lowered its adjusted EBITDA net-of-NCI midpoint from $2.715B to $2.664B, or 1.9%. The implied full-year margin midpoints fell ~32 bps and ~30 bps, respectively. This changes our initial post-HCA/THC conclusion that HCA’s reset was ‘not inevitable.’ The fuller picture is that hospital pressures are real and still developing, but THC’s multi-year Hospital margin expansion story and likely greater initial guidance cushion allowed it to more than absorb them, while HCA and UHS had to reset.
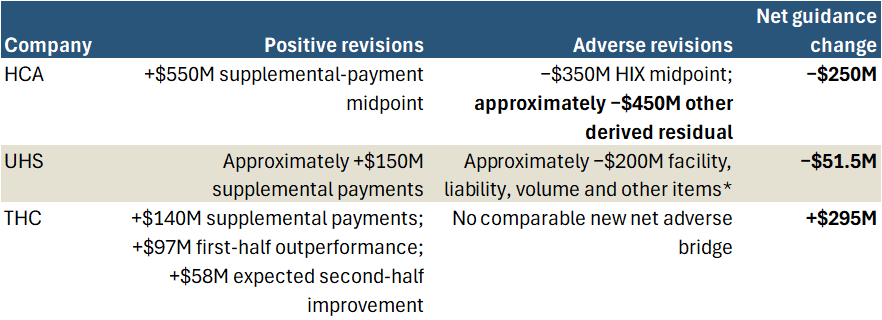
The similar headline cuts came from meaningfully different bridges. UHS added ~$150M of supplemental-payment benefits against ~$200M of facility, liability, volume and other pressure. HCA’s HIX-headwind midpoint worsened by ~$350M while its supplemental-payment midpoint improved by ~$550M; despite that net $200M benefit, EBITDA guidance still fell $250M, implying a residual ~$450M of other adverse revisions. That residual is derived, not management disclosed, but reinforces that HCA’s reset was broader than HIX alone.
Exhibit 2: HCA and UHS Reset ~2%; THC Raised Guidance on Hospital Outperformance and Supplemental Payments
Panel A: Guidance Midpoint Changes
Panel B: Approximate Guidance Bridges
Actual HIX attrition was not meaningfully different across the group, but initial assumptions were. UHS entered the year assuming exchange volume would decline >25%; the actual 1H26 decline was smaller. It did assume 10%–20% of affected patients would find other commercial coverage, which did not materialize, but the worse migration outcome in 2Q26 only increased the projected FY26 headwind by $10M to ~$85M. HCA correctly forecast 15%–20% attrition, but assumed 15%–20% of affected patients would migrate to employer coverage and utilization among those becoming uninsured would fall ~30%. Neither occurred, driving HCA’s much larger HIX reset. THC characterized both the exchange decline and uninsured conversion as roughly in line with its planning assumptions. The distinction is that UHS was more conservative on the volume decline, HCA was right on attrition but wrong on post-coverage behavior, and THC appears to have had both adequate assumptions and enough cushion.
HIX assumptions explain part of the difference, but margin runway and available offsets are what separate THC from the pack. HCA entered 2026 with a more mature margin base: FY25 adjusted EBITDA margin was 20.6%, up ~90 bps y/y, leaving less obvious incremental cost and margin-recovery runway. That does not mean HCA is fully optimized or cannot drive additional efficiencies, but the starting point matters. UHS is harder to characterize. Same-facility EBITDA growth remained positive, but its guide cut reflected a combination of facility-specific issues, liability pressure and lower volume assumptions; there is not enough evidence to describe UHS as either fully optimized or on a THC-like recovery path. THC’s raise was overwhelmingly a Hospital-segment event: Hospital adjusted EBITDA guidance increased $285M versus only $10M for USPI. However, ~$140M of the total $295M raise came from supplemental payments, with the balance reflecting 1H outperformance and better 2H operating assumptions. USPI remains a structural portfolio advantage, but it was not the principal driver of the FY26 raise.
Expectations Explain the Reaction
UHS opened ~6% below the prior close before reversing to finish up 4.3%, an ~11% open-to-close swing. HCA and THC also closed up 7.3% and 7.8%, respectively. By no means does that rally mean that sector pressures went away. Expectations were particularly low for UHS with the stock entering the print at 5.6x NTM EBITDA, near a 10-year low and well below its 8.2x median. UHS avoided another outsized HIX reset, and same-facility segment EBITDA growth remained positive. Expectations and valuation gave investors room to look through a modest miss/guide cut and distinguish company-specific UHS problems from a new sector-wide traffic shock. Using distinct pre-earnings baselines, HCA FY26/FY27 EBITDA consensus has declined 1.4%/2.5% since July 13, while THC FY26/FY27 EBITDA consensus has increased 4.6%/2.7% since July 22.
What Matters Next
What matters next is less about whether the 2Q26 pressures were real—UHS now confirms that they were—and more about how they develop from here. The key questions are whether uninsured patients sustain comparable acuity and procedure intensity, what hospitals ultimately collect on those encounters, and whether surgical weakness stabilizes or expands beyond exchange-affected markets. We also need to monitor whether professional-fee inflation and UHS liability expense remain elevated, whether HCA and UHS can deliver their implied 2H26 outlooks, and whether THC can sustain Hospital margin improvement as supplemental-payment benefits normalize. 2Q26 established that the hospital pressures are sector-wide and earnings-relevant. The remaining debate is which operators still have enough pricing, cost, reimbursement and margin runway to absorb them.